6.34K+ Clicks & 234K Impressions! A Practical Guide to Scaling Organic Search Growth in the AI Era
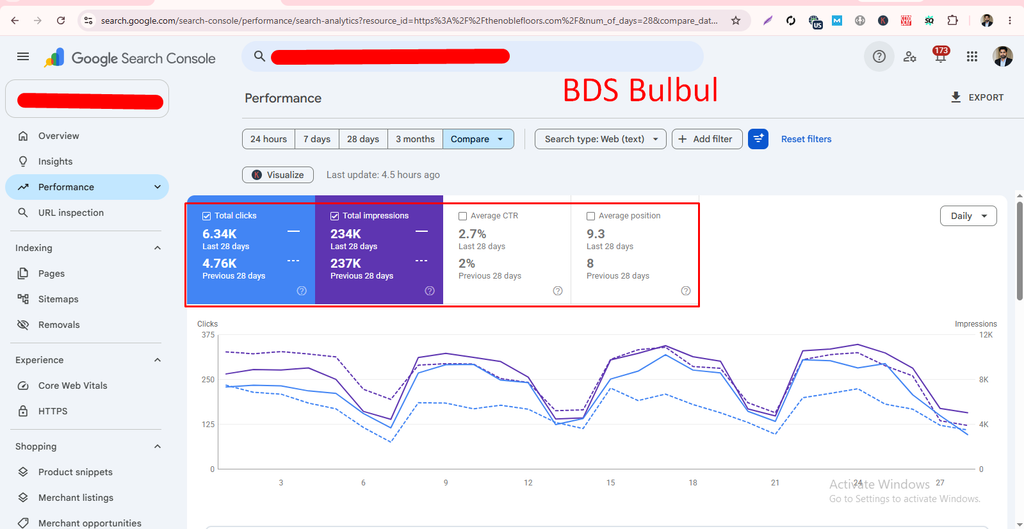
Get Straight to the Point: In the modern era of AI and advanced search engines, neither readers nor algorithms appreciate fluff. To succeed in SEO, your core answer must be delivered within the first three lines so that search snippets feature your content directly. Core Challenges & Our Modern SEO Frameworks To stay ahead of search engine volatility, modern content strategies rely on 4 golden rules: Verified Performance Summary (Last 28 Days) Review our comparative Google Search Console performance metrics below: Performance Metric Current Period (Last 28 Days) Previous Period Growth & Impact Screenshot_4.png Total Organic Clicks 6.34K 4.76K Massive high-intent buyer traffic growth Total Impressions 234K 237K High-converting targeted search visibility Average CTR 2.7% 2% Enhanced click-through engagement Average Position 9.3 8 Stable Page 1 positioning and traffic scaling Conclusion & Next Steps for Your Brand Is your website struggling to maintain steady traffic amidst shifting search algorithms? Sustainable long-term growth requires an expert, algorithm-proof search roadmap. I am BDS Bulbul Ahmed (Senior SEO Consultant with 6+ Years of Experience & 250+ Successful Projects), ready to scale your organic search revenue and brand authority. Get Your FREE SEO & Growth Audit Today! Send us your website URL to receive a comprehensive Free Audit & Growth Roadmap identifying your exact ranking bottlenecks.
A Client Website Search Console Case Study
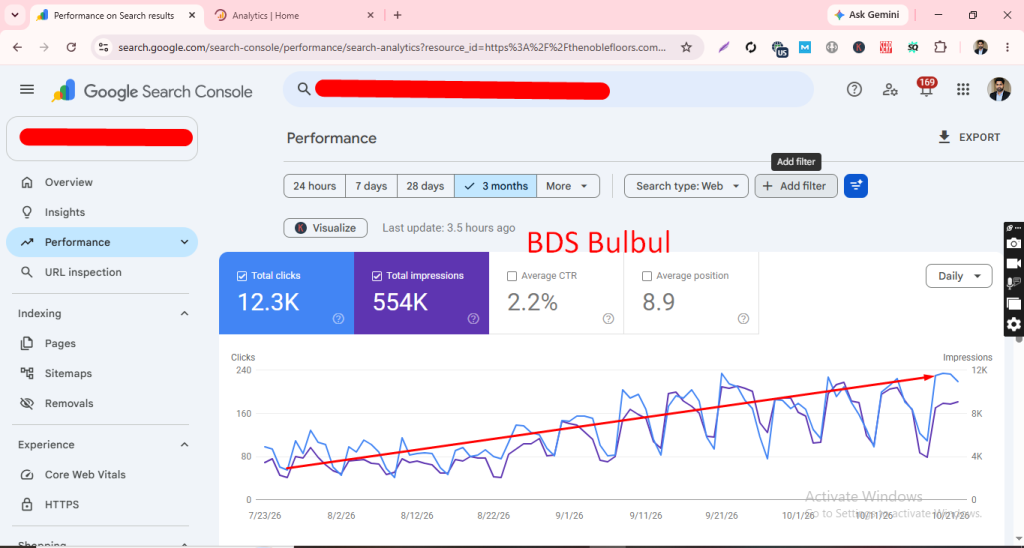
In SEO, data is the real proof, and it is far more credible than any agency’s claims. In this article, we walk through the actual Google Search Console performance report of one of our client websites, what happened over the last 3 months, and what these numbers mean for your business. (The client’s website name is not disclosed to protect their privacy.) Quick Summary (3-Month Results) Period: July 23, 2026 to October 21, 2026 (Search type: Web) Metric Result Total Clicks 12.3K Total Impressions 554K Average CTR 2.2% Average Position 8.9 What Does the Graph Tell Us? The Performance graph shows a clear upward trend. In late July, daily clicks were roughly around 80, and impressions were around 4K. By the third week of October, daily clicks had climbed above 200 and impressions reached about 12K. Based on the graph, clicks grew roughly 2.5 times and impressions roughly 3 times. Both clicks and impressions grew together. This is a healthy sign, because it means Google is showing your pages in more searches, and people are clicking through. How to Read Each Metric 1. Total Impressions (554K): Your pages appeared in Google search results this many times. This is visibility, not visitors. Growing impressions mean you are showing up for more keywords in front of more people. 2. Total Clicks (12.3K): People came to your site from search this many times. For a business, this is the most useful number, because leads and sales come from clicks. 3. Average CTR (2.2%): About 2.2 clicks for every 100 impressions. We still see this as room for improvement. Better titles and meta descriptions can earn more clicks from the same impressions. 4. Average Position (8.9): On average, the site sits near the bottom of page one. A position of 8.9 means many keywords are on the first page while some pages are on the second. In other words, there is still room to climb. One Important Point to Remember Average position in Search Console is an average. Every keyword has its own position, and no agency can guarantee a specific ranking by a specific date. Consistent upward movement in the data is the real sign of progress. In this case study too, you will notice weekly ups and downs in the graph (traffic dips on weekends), but the overall trend is upward. What Usually Drives Consistent SEO Growth Content matched to search intent: Structuring pages around what people are actually looking for. See our On-Page SEO service. Technical health: Keeping indexing, site speed and Core Web Vitals in good shape. See our Technical SEO service. Keyword research: Finding low-competition, high-intent keywords. See our Keyword Research service. Building trust: Quality backlinks and brand signals. See our SEO Link Building service. Ongoing monitoring: Reviewing Search Console weekly to spot which pages are performing and which are falling behind. What Does This Mean for You? If your Search Console shows impressions growing but clicks not following, or the graph is flat, an audit can pinpoint the problem. We analyze your site and build a prioritized action plan. Frequently Asked Questions (FAQ) What is the difference between impressions and clicks in Search Console? Impressions are the number of times your page appeared in search results, and clicks are the number of times people visited your site from those results. Is a 2.2% CTR good? CTR depends on the industry, keyword type and position. Instead of judging from a single number, look at the trend over time and page-level CTR. How long does SEO take to show results? It depends on competition and the site’s current condition. SEO is generally a long-term process, so consistency matters most. Does an average position of 8.9 mean all keywords are on page one? No. It is an average across all keywords. Some rank higher and some lower. Ready to Grow Your Website’s SEO? We offer free consultations. Contact us on WhatsApp or visit our SEO Services page. Author: Bulbul Ahmed, Senior SEO Consultant, BDS Digital Marketing Agency